
Making Data Fit for Purpose
Scoring Big on Insight from Effective Data Cleansing and Contextualization
William Shakespeare wrote, “…the readiness is all.” He was onto something.
When it comes to time-series data, there is no shortage of options. Cloud-based, data-lake, open source, and historians are all readily available solutions for data storage, along with lower prices for sensors (data creation), and wired or wireless offerings for data aggregation. This creates an immense opportunity for operations to leverage the data created by their processes and assets, but also leaves a gap which is commonly referred to as being data rich, and information poor (DRIP).
What’s the barrier to getting insights from collected data? Simply put, the data just isn’t ready for it. Raw data is not ready for analysis and the realization of benefits. Some organizations report over 70 percent of the time dedicated to analytics is just for data cleansing–taking the data from “raw to ready.” But subject matter experts and process engineers aren’t “data janitors.” The monotonous and time-consuming tasks of accessing, cleansing, and contextualizing data for the analytics process must be addressed.
Data Security
While the goal of analytics is insights, data security is, and will always be, a top priority in organizations. For this reason, there are rules and processes within an operation’s “data governance” protocols that prevents access to data by employees within the organization. This can be a hurdle. When enabling access to process data only subject matter experts (SME) with proper authorization should be allowed access to the source data of a plant or facility.
Further, when expanding access to other employees in manufacturing operations, it’s essential the process data is kept and stored in its native form without any cleansing or summarization. The slightest assumption regarding how to change the data before the time of analytics could negatively impact or degrade the opportunity for insights to come.
Empowering Experts With Actionable Data
SMEs and process engineers, who have been analyzing data in spreadsheets for an entire generation, are where the work takes place for taking data from “raw to ready.” When it comes time to decisions about data cleansing and contextualization steps, these individuals must make sure that the results of analytics are not misdirected, that the correlations and relationships are fit for data algorithms in terms of the manufacturing process. An algorithm that is incorrectly fit for big data can quickly cause a whole world of potential problems.
With the experts in process manufacturing operations on the front lines of configuring data analytics, improvements to yield, availability, productivity, and margin improvements are just around the corner.
Contextualizing Data for Analysis
Contextualization comes into play when SMEs prepare the data for analytics through integration and alignment of data from multiple types of sources. This is sometimes also referred to as data harmonization, data blending, data fusion, or data augmentation. Essentially, SMEs are matching up unlike data types to inform a full-picture model of the process, combining things like the sensor data, what the asset or process is doing at the time, and which parts of the data are important to your operation.
Let’s look at a specific example of the challenges that arise when working with time-series data. With a data set with a sensor reporting data every second for a year which results in a total of 3.1 million data points for the year in the form of timestamp:value.
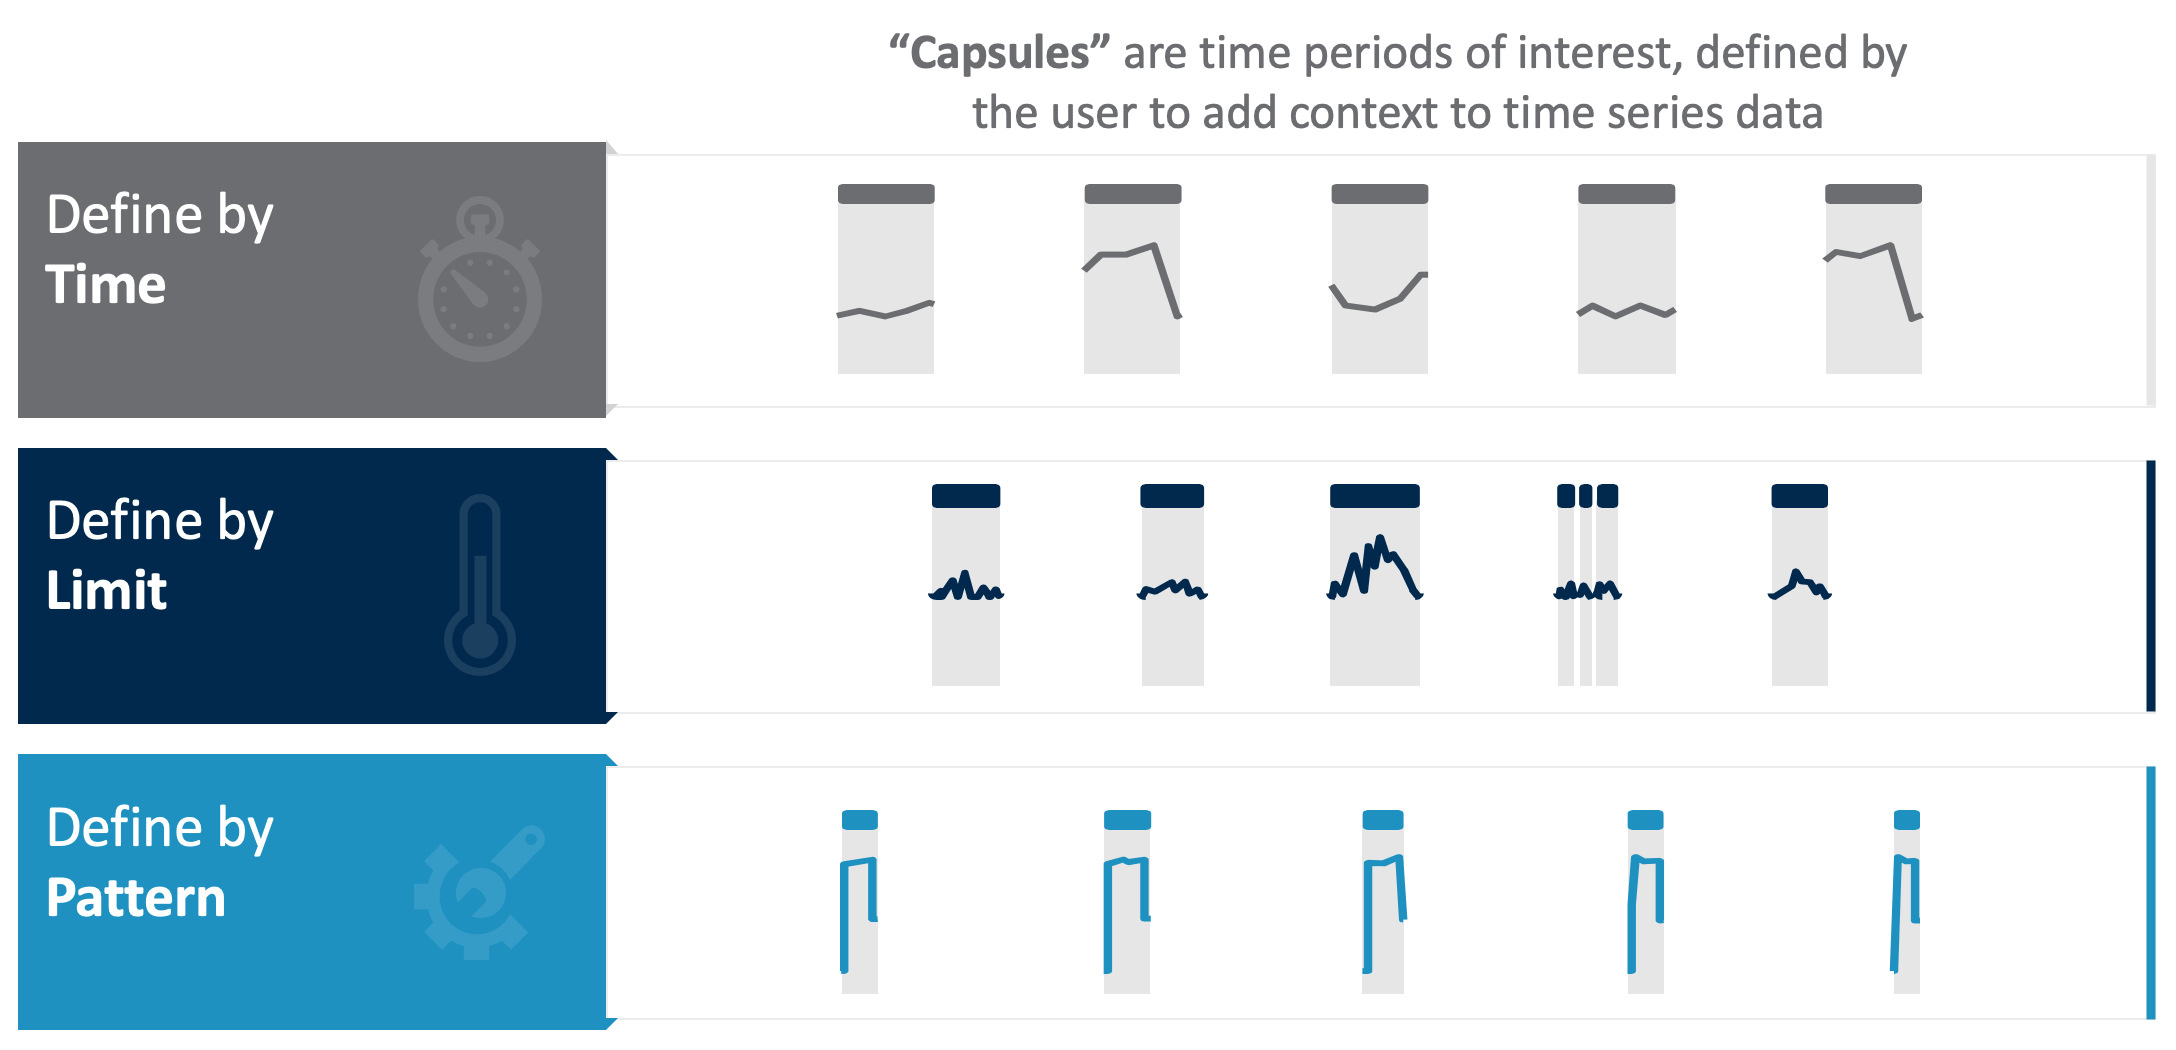
It’s safe to assume that an organization’s engineers would only want to point out specific periods of interest within this year-long signal. Here are a few examples of what they may be interested in focusing on. The data points that occur when the following conditions are true can be used for analytics, and the rest can be virtually ignored:
- Time period: by day, by shift, by Wednesdays, by weekdays vs. weekends, or more.
- Asset state: on, off, warmup, shutdown, or more.
- A calculation: time periods when the 2nd derivative of moving average is negative
- Data samples that are errors: lost signals, flyers, drop-outs, or other issues that require cleansing to improve analytics accuracy
These identified time periods may be used as integration points with relational or discrete data types.
What is apparent from this example is even with just a year of recorded data from only one signal there is an unlimited number of opportunities to split up the data in different ways. Choosing time periods of interest is an important decision for SMEs to make when transforming data to a ready-for-analytics state. Some chemical production environments have 20,000 to 70,000 signals (or sensors), oil refineries can have 100,000, and enterprise sensor data signals can reach the millions. The amount of data can be overwhelming, but tactfully refining it can lead to greatly advantageous insights.
Another hurdle to consider when making time-series data ready for analysis includes the interpolation and calculus involved in analyzing data, which is something that can be missed by IT- data consolidation and aggregation methods. Manufacturing-specific solutions are required, providing the ability to align signals with different sample rates, from different data sources, in different time zones, and other changes is unquestionably necessary before defining relevant time periods of interest.
The Final Step: Contextualization for Access
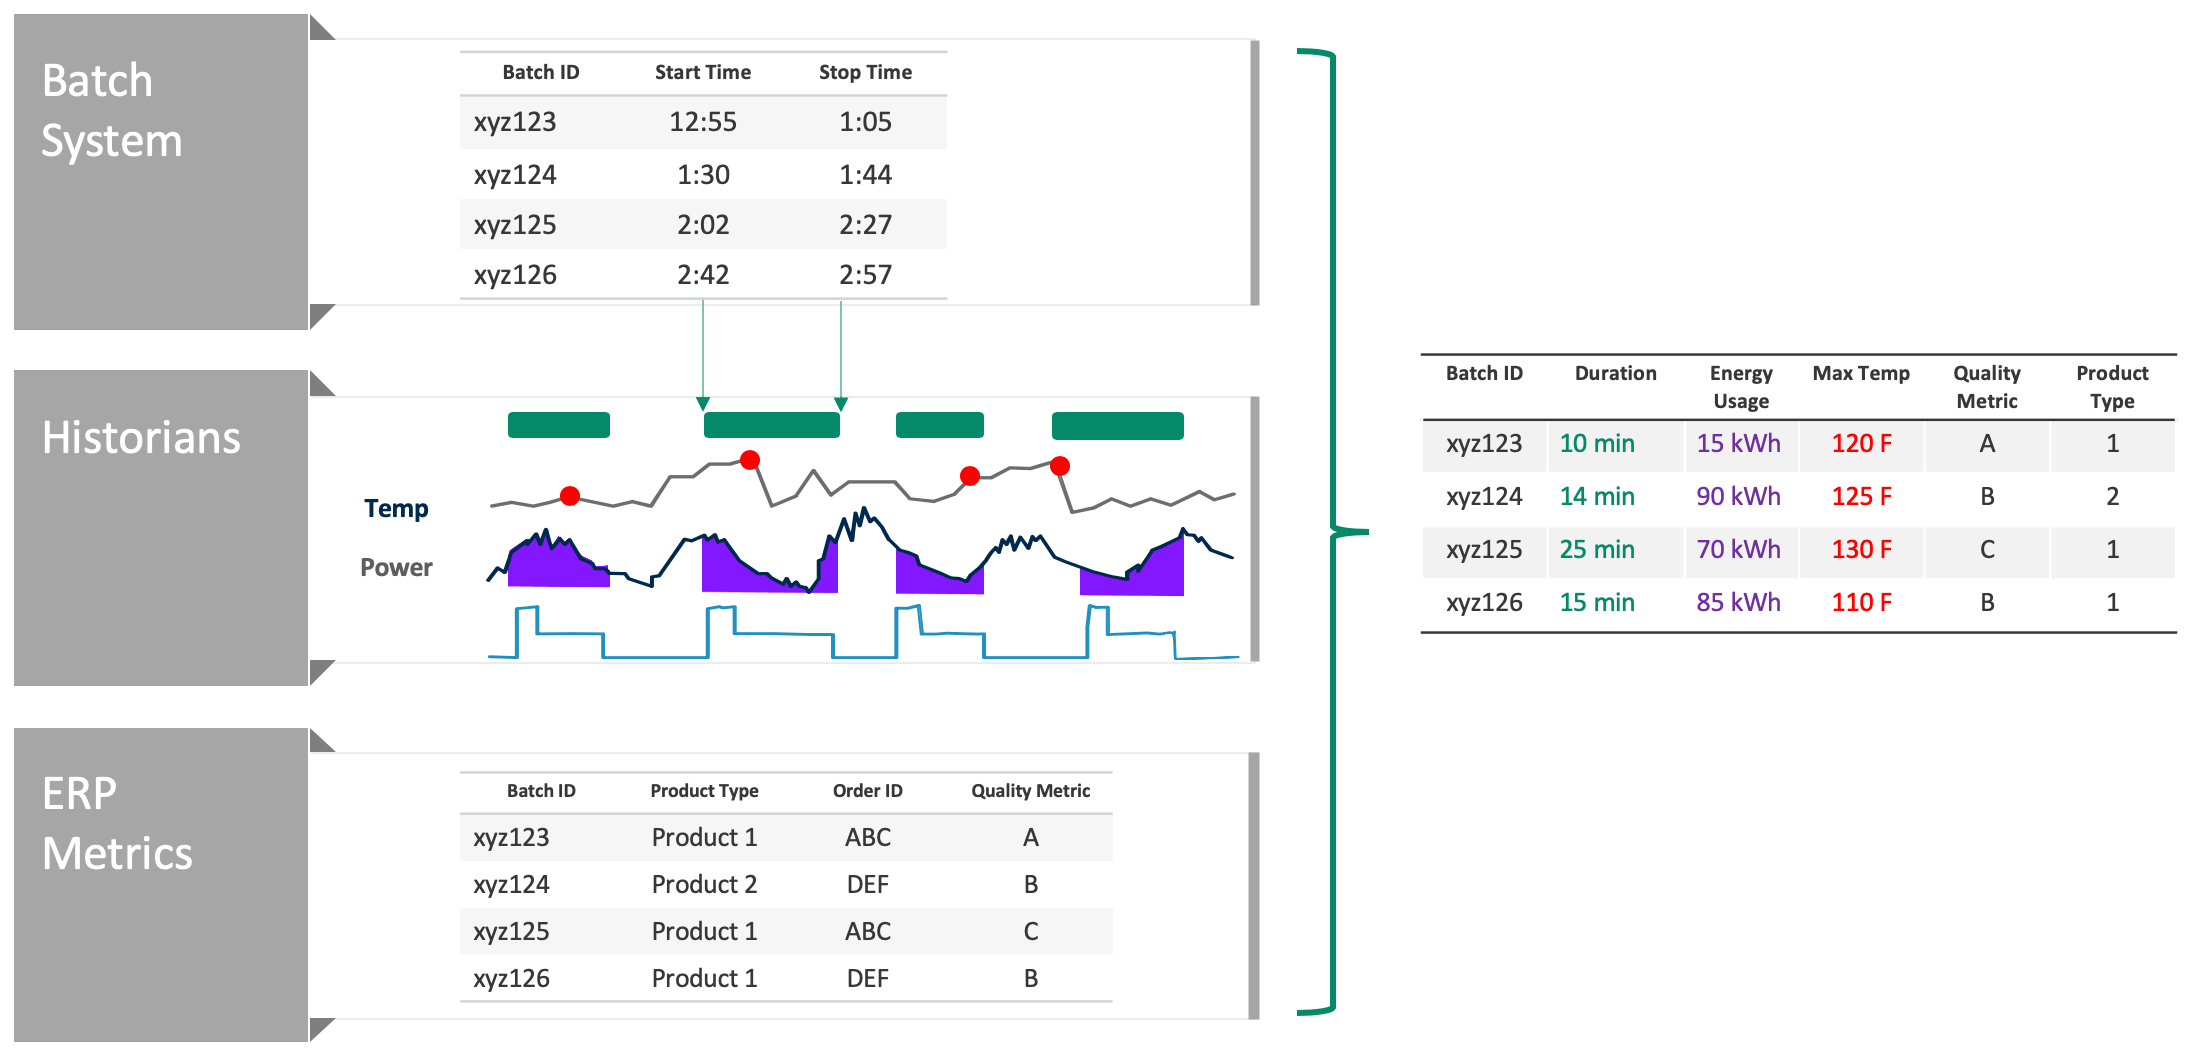
A way to expand on data gathered from specified time periods of interest is to contextualize with data from other sources to have an impact on overall business outcomes. When combining various unlike data sources, common questions can include:
- What is energy consumption when making Product Type 1 versus Product Type 2?
- What is the impact of temperature on product quality?
- Does power consumption change as batch completion time varies?
Some examples of other data sources include laboratory information systems, manufacturing execution systems, enterprise resource planning systems, external raw material pricing systems, and more.
Here is an example of data contextualization to combine and work with data from multiple sources. The result is a table (Figure 3), which is easy to understand and manipulate, accessible to SMEs, process engineers, and any analysts using a business intelligence application such as Microsoft Power BI, Tableau, or Spotfire.
An Insightful Future for Time-Series Data Analysis
There is tremendous focus on digital transformation making its way onto the radar of industrial organizations. Combined with the pressure of integrating IT and OT assets to develop a holistic view across business and data sets, this attention makes it more important than ever for process manufacturers to understand the importance of proper data cleansing and contextualization of their time-series data to lead them to insights as vast as their raw data sets themselves—a gap that has existed for far too long.
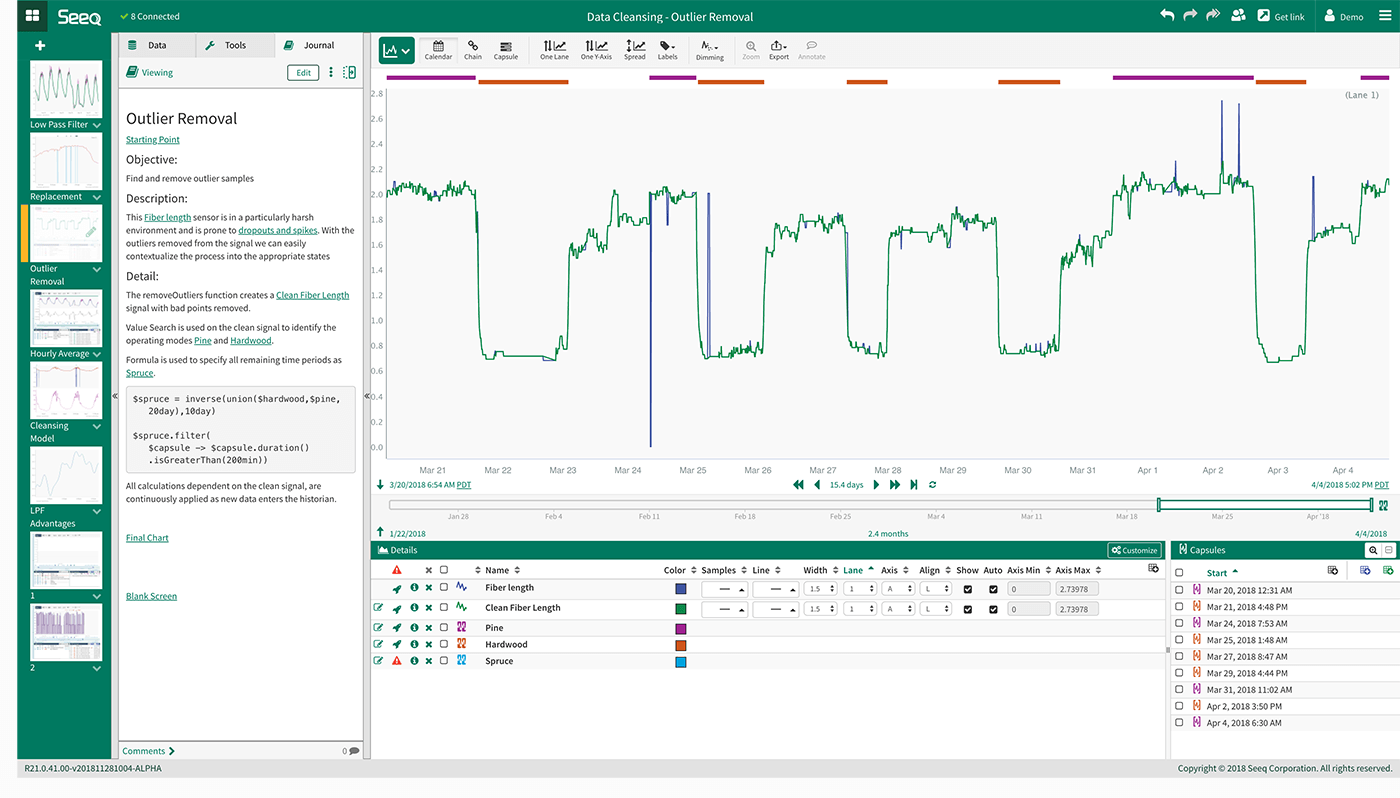
If you’d like to see Seeq’s advanced analytics application gathering insights from data in action schedule a live demo today!