
Incorporate Change Detection into Process Monitoring
Enabling Small and Mid-Size Enterprises to Proactively Identify Process Changes
Depending on the type of problem a subject matter expert (SME) is trying to solve, there are countless different ways they can monitor for changes in process data. As simple as it seems to look at data and identify a change in the way it is behaving, this methodology is not always straightforward due to the lack of advanced analytics capabilities in the engineering toolbox.
At Seeq we use a wide variety of change detectors built into our point-and-click tools, along with customizable formula functions and advanced algorithms implemented in Seeq Data Lab, to automatically monitor process data for changes.
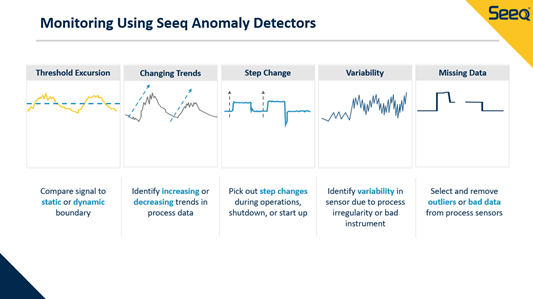
Here are a few examples of Seeq change detection methods:
- Monitoring for deviations versus a limit
- Searching signals for increasing or decreasing trends
- Comparing to “Golden Profiles” using Statistical Process Limits
- Using machine learning techniques
These different anomaly detectors (Figure 1) can be applied to process monitoring in many different industries. Most of these change detectors will be almost impossible to deploy in a timely and efficient manner using Excel-based tools full of rows and columns of data.
Fortunately, advanced analytics software is now available to empower subject matter experts (SMEs), accelerating the speed at which they can gain insights from their data, as shown in Figure 1 and explained in detail below:
Process Monitoring for deviations versus a limit
The simplest change detection method is monitoring process signals versus a limit. These limits are often static values, for example a safety limit on a piece of equipment, such as the pressure rating on a vessel. Limits can also be dynamic, like those based on a quality specification that changes for the different grade of chemical being produced. This type of change detection has been possible to monitor using time series trends in Excel, but the difficulty comes into play when the SME wants to do quantification on exceedances over time. With Seeq, these types of deviations can be identified using Value and Deviation Search tools, and quantifications of the exceedances can then be completed in minutes using Signal from Condition, Scorecard Metric, and Histogram functionalities.
Searching signals for increasing or decreasing trends
Often signals will not necessarily exceed a threshold, but will instead be increasing or decreasing due to something occurring in the process. SMEs need to quickly identify when a signal is changing or has flatlined. This is especially common during abnormal operations, such as startup and shutdown periods.
An example of this would be an increasing or decreasing trend on a distillation tower’s level or mass balance. Engineers and operators need to be able to quickly identify this type of event and make changes in the process to prevent a tower overfill. Temperature profiles and ramp rates in reactors are also very important to ensure reactors are not in a runway condition, and to protect expensive catalyst meant to last for many years.
Performing these calculations properly typically requires creating a derivative of process variable to determine its rate of change. Seeq’s formula tool can be used to quickly calculate these types of time-based statistics, and to monitor for deviation outside of normal ranges. Other techniques that can be applied to help identify quickly changing signals are running deltas, continually updating standard deviations, and other detection methods to determine if a signal has flatlined, or stopped moving as expected.
Seeq’s Organizer Topic can be used to roll up important abnormal operations trends into one report, and set to automatically update to identify any new abnormalities in the trends, display a user-specified number of the most recent change events, etc.
Monitoring versus "Golden Batches" using Statistical Process Limits
With batch processes, often found in the pharmaceutical and petrochemical industries, it is common to monitor current campaigns versus a series of golden batches. These golden batches are defined by cycles that were identified as having ideal conditions for optimal production outcomes.
Identifying and updating golden batches using traditional tools like Excel is extremely tedious. Using Excel, it is even more difficult to monitor in near real-time and determine how a process is performing in comparison to golden batches.
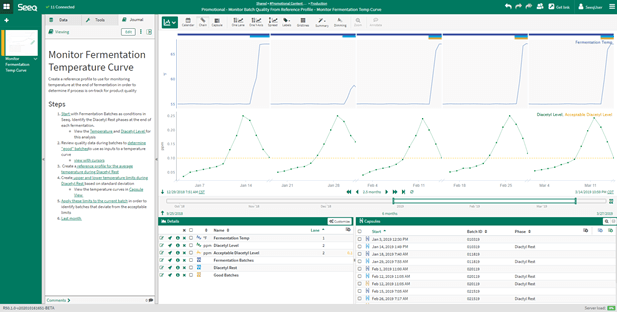
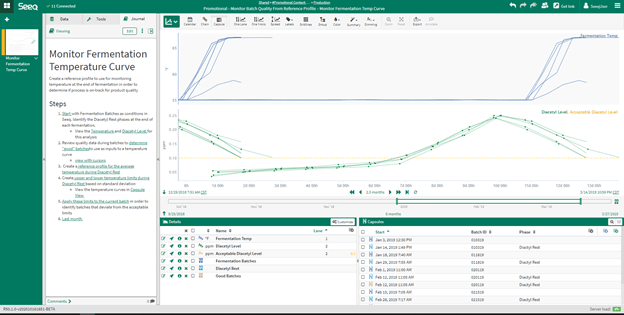
With Seeq, SMEs can compare batches side by side using the Chain View functionality (Figure 2) or overlay them on top of each other using the Capsule View option (Figure 3). These innovative views allow SMEs to rapidly determine which batches led to the best production outcomes.
Once the golden batches have been identified, the user can then use these reference profiles and apply statistical process limits to identify in near real-time when the process is operating outside of the defined statistical limits. This type of analysis enables operators to proactively correct any operating limit deviation, minimizing batch times and maximizing throughput.
Machine Learning Techniques
In recent years, machine learning (ML) has gone to the top of the charts in terms of buzzwords related to change and anomaly detection, with a variety of available techniques. Seeq aims to bridge the gap between SMEs and data scientists, democratizing ML for all audiences. This is done by embedding techniques in simple point and click tools, with the power of ML used by SMEs who don’t have to possess a deep knowledge of the technology.
Profile Search, for example, enables SMEs to highlight a signal pattern on a trend (i.e. a known precursor to equipment failure), and quickly find other occurrences of the same pattern for that signal. A new condition is then created every time the defined profile occurs. The end user only needs to provide three inputs for the algorithm to run: the shape they are looking for and how similar they want future instances to be in terms of length and magnitude.
Another example of ML built into Seeq is the prediction tool, which enables users to predict signals based on other correlated signals using a variety of different regression model types. Users can create auto updating prediction models based on continually changing training windows. Many of Seeq’s built in formula functions for signal smoothing and outlier removal also apply ML algorithms, running in the background without any required user intervention.
At the other end of the spectrum, Seeq empowers data scientists to build their own change detection programs in the Seeq formula tool, or in Seeq Data Lab (a Jupyter Notebook based environment) for more complex algorithms. These algorithms can be sourced from Seeq IP, Customer IP, or Open Source code. Data scientists can also run the Seeq Python module in any other application that is already integrated into their workflow, such as Amazon Sagemaker, Azure Notebooks, or Anaconda.
Getting Insights from Identified Periods of Interest
The above methods are just a few examples of the endless opportunities SMEs have when an advanced analytics software like Seeq is placed in their hands. Once areas where the process is changing have been identified, teams can start gaining value from their data by quantifying metrics about the new conditions they have identified. Examples of these metrics are:
- How long did the change last?
- How large was the change versus normal operation?
- How many times has the deviation occurred in the past?
- Are the process change events increasing or decreasing in frequency?
- When do we predict the condition will occur again?
Once these metrics have been calculated—this information can inform the organization to make decisions—such as process changes to return to normal conditions, potential operating envelope or limit modifications, or adjusting predicted maintenance timing for a piece of equipment.
Enabling SMEs to proactively identify process changes is the first step on the journey from reactive analytics (taking action after a failure has occurred) to predictive analytics (proactively identifying a potential failure and making changes to eliminate or minimize downtime events).
Ready to see Seeq’s advanced analytics application in action? Schedule a demo today!