
Operationalizing Batch Analytics
Operationalizing advanced analytics applications for batch product quality and yield can benefit the pharmaceutical, specialty chemical, and food & beverage industries.
The cost of a bad batch can be between $20,000 and $2.5 million. Golden batch profiles enable manufacturers to monitor their processes to ensure quality batches, but, historically, creating these profiles has required several hours of time spent manually sifting through years of historical batch data.
By leveraging self-service analytics applications, subject matter experts (SMEs) can accelerate time to insights throughout this process, enabling them to quickly investigate and minimize batch deviations through root cause analyses and ongoing monitoring of critical process parameters. Production should be optimized for yield while maintaining product quality.
Operationalizing advanced analytics applications for batch product quality and yield can
- aid in fault detection,
- enable rapid root cause analysis,
- transform golden batch development timelines,
- ensure that quality standards are maintained,
- and reduce wasted time, energy and materials.
As a result, Seeq saves millions of dollars each year in batch quality for process manufacturers, particularly in the pharmaceutical, specialty chemical, and food & beverage industries, and reduces the time to create and deploy golden profile monitoring solutions from months to hours.
In a recent webinar, we walked through common Seeq batch analytics use cases, which are summarized below.
Capsules and Golden Batches
Eliminating variability and streamlining the batch process are critical when forming the backbone of operational excellence initiatives.
Seeq’s capsule structure allows SMEs to identify and isolate periods of interest based on the patterns in batch data. Time series process data can be contextualized by the procedural control model in accordance with the ISA-88 standard. Using Seeq’s Chain and Capsule Time View, SMEs can view operations, phases, or other periods of interest end-to-end or overlaid, enabling rapid identification of differences in operation.
A golden or best possible batch is a common benchmark in batch processing that allows SMEs to see the best-case scenario if a batch runs optimally. Seeq’s capsule functionality enables users to quickly create golden profiles for each phase of interest and combine them into a final batch profile for monitoring. By operationalizing these profiles, engineers and operators can capture times where a process variable is deviating from the golden profile and make necessary corrections to ensure quality product.
Batch Tracking and Cycling Analysis
Batch manufacturing processes typically consist of a combination of complex unit operations and phases. Manufacturers, therefore, strive to optimize each phase of the batch process. Shaving off even a small amount of time from a phase results in increased production, which directly drives improvement in profitability.
However, manufacturers frequently struggle to analyze their batch cycle times. The process requires sorting through spreadsheets, which typically have limitations that make them unsuited to this level of analysis. It’s extremely difficult and time consuming for process engineers and teams to accurately define phases and idle times that can be used to pinpoint process improvement and capital deployment opportunities.
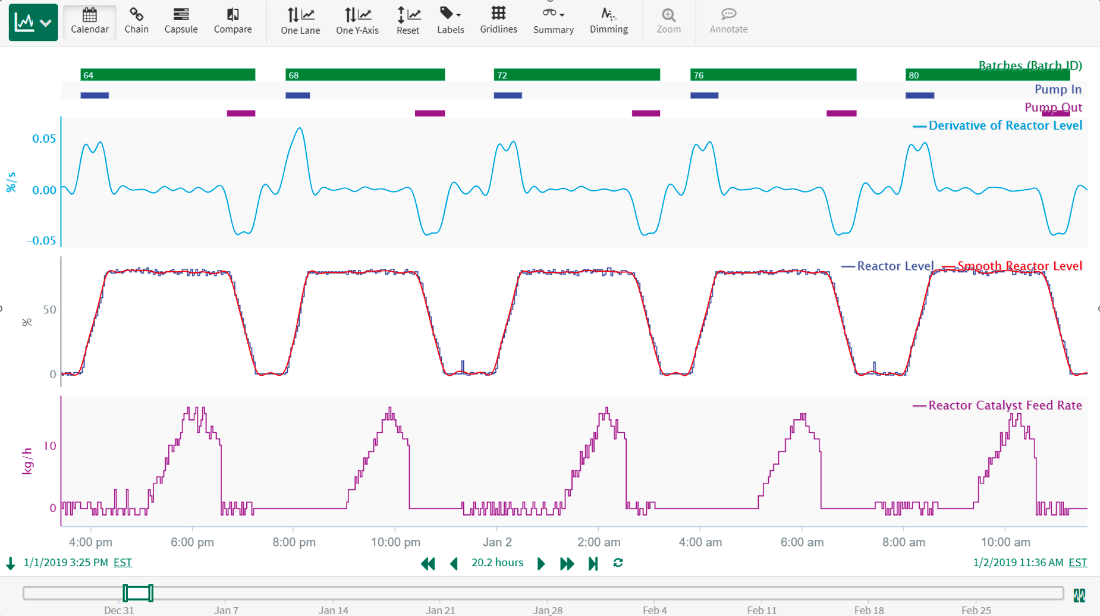
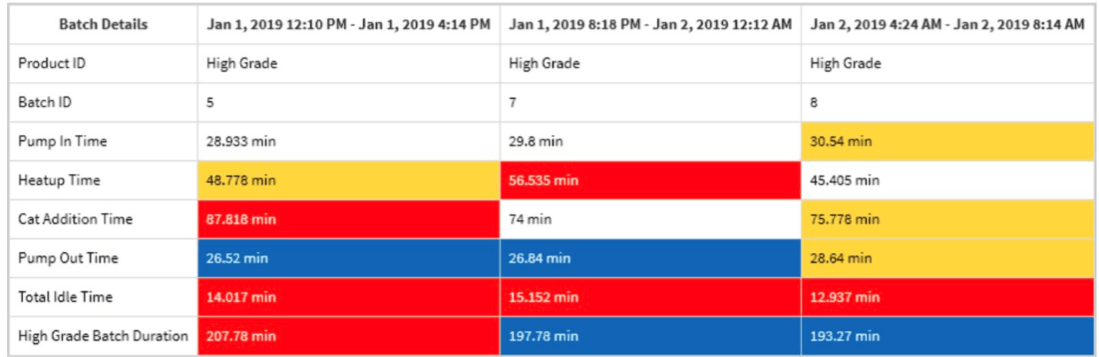
Utilizing Seeq, process engineers can use their typical process variables and string signals to separate each batch into phases with simple point-and-click tools. This enables them to identify the best cycle time for each phase, which enables engineers to take actions, such as adjusting a pump speed or adding catalyst earlier in the process. Engineers can then flag phase durations that are abnormally long, systemically eliminate variability, and monitor phase durations to reduce batch idle time and optimize turnaround times. Improvements in cycle time and reduced batch to batch variation can compound to a significant financial impact over time.
Advanced Modeling – PCA Regression
Each unit operation in a batch process is typically monitored through at least dozens of critical parameters. In the event of a fault, deviation, or large root cause investigation, it’s not uncommon for the number of parameters to increase. It can be a significant challenge to prioritize the correct parameters. Even when prioritized, engineers are often left looking for the needle in the haystack or ignoring potential signatures in the data that are overlooked in their efforts to quickly find the problem or opportunity they’re looking for.
Engineers and data scientists tasked with monitoring, investigating and pinpointing root causes need a solution to monitor numerous parameters and rapidly identify and prioritize the problems, allowing them to take action to solve the problem or optimize the process. Principal component analysis (PCA) can be leveraged in Seeq to help address this challenge. By dimensionally reducing the total parameters monitored, the user can focus on one or two principal component parameters to monitor as opposed to the original hundreds or thousands of inputs. Although PCA is not a novel method, the ability to deploy the statistical analysis in Seeq allows a wider user group to leverage this methodology.
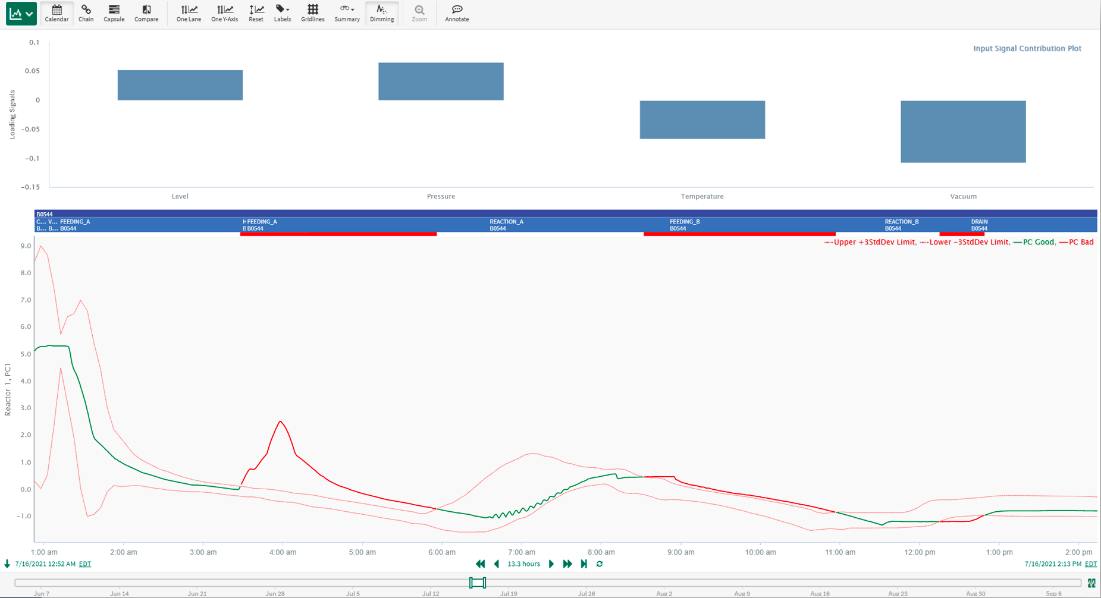
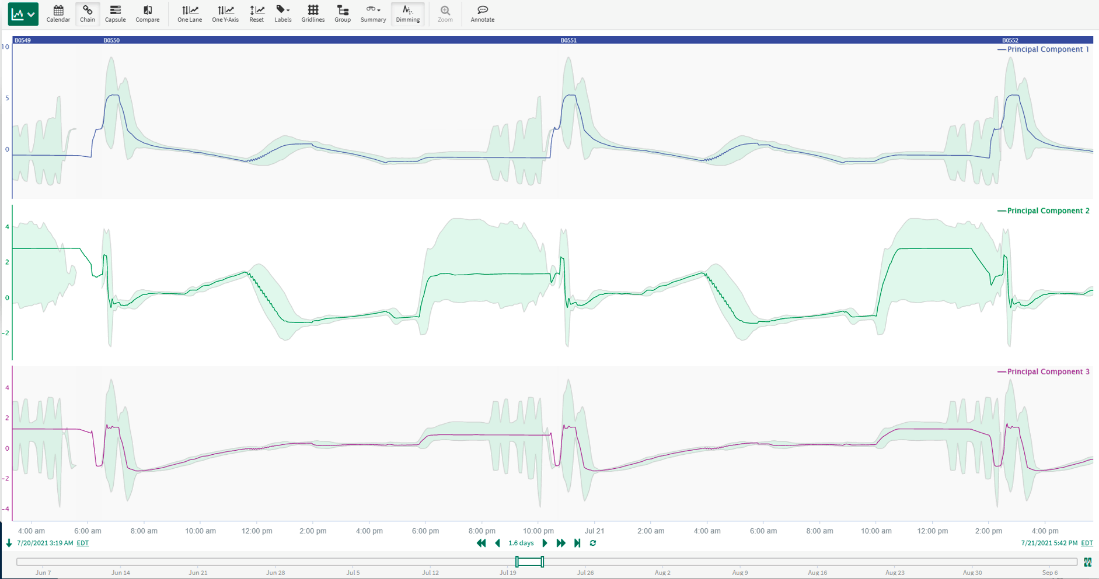
With the implementation of the PCA model in Seeq, faults, deviations, and the contributing parameters can easily be identified. The principal components are monitored in Seeq for any deviations based on engineer or process defined limits. The result being exception-based monitoring that can be drilled into to identify areas and parameters for the engineer to focus their efforts. This significantly reduces an engineer’s time spent scrutinizing, instead, shifting their efforts to fixing the problem or optimizing the process.
Batch Monitoring and Reporting
One of the largest challenges in batch process monitoring, or report generation, is gathering data from multiple process lab or maintenance sources into a single environment. Seeq takes this burden off the user by indexing data from all data sources and making it available to users in a single interface that enables rapid calculations of statistical limits, KPIs and aggregations using robust analytics tools. Any calculated item can be easily audited to track changes, ensuring compliance of GMP calculations.
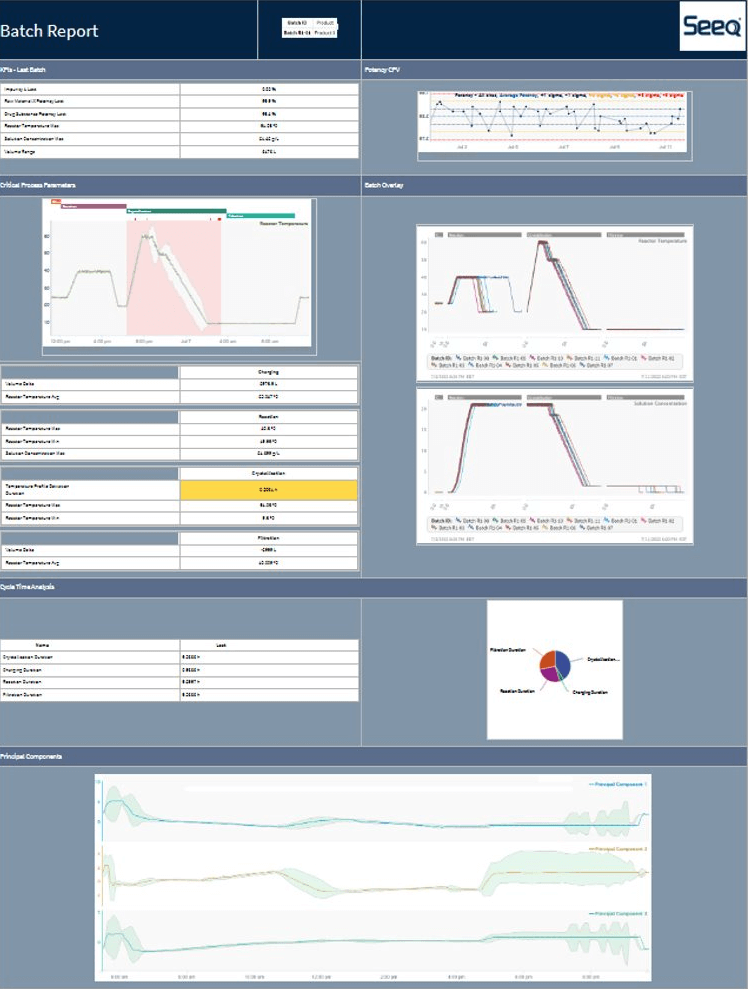
These trends and metrics can then be assembled into static batch reports, or live updating dashboards in an Organizer Topic to aid immediate monitoring decision. These Topics bring analysis together and support ongoing monitoring, knowledge capture and collaboration across an organization.
Watch the Webinar Today
Interested in learning more about using Seeq for your batch analytics use cases? View the full webinar to see the technology in action. And if you are ready to discuss how Seeq can improve your operations, please contact us to speak with one of our industry experts and schedule a demo today.